Executive summary
Members of Congress disclosed 16,203 stock trades between 2020 and 2024. The 220 purchases we could cleanly benchmark against the S&P 500 beat the index by an average of +2.58% over the following 90 days — statistically significant at p < 0.05. The same group of legislators’ sales underperformed by -1.67% over the same horizon, suggesting timing skill is concentrated on the entry side.
Key statistics
Methodology
For each disclosed purchase with a resolvable ticker and sufficient price history, we computed the buy-and-hold return over 30, 90, and 180 days from the transaction date. We subtracted the S&P 500’s return over the same window to isolate the excess return, then ran a one-sample t-test against a null of zero alpha.
The 90-day window was the pre-registered horizon. 30- and 180-day results are reported but should be treated as exploratory — no multiple-testing correction.
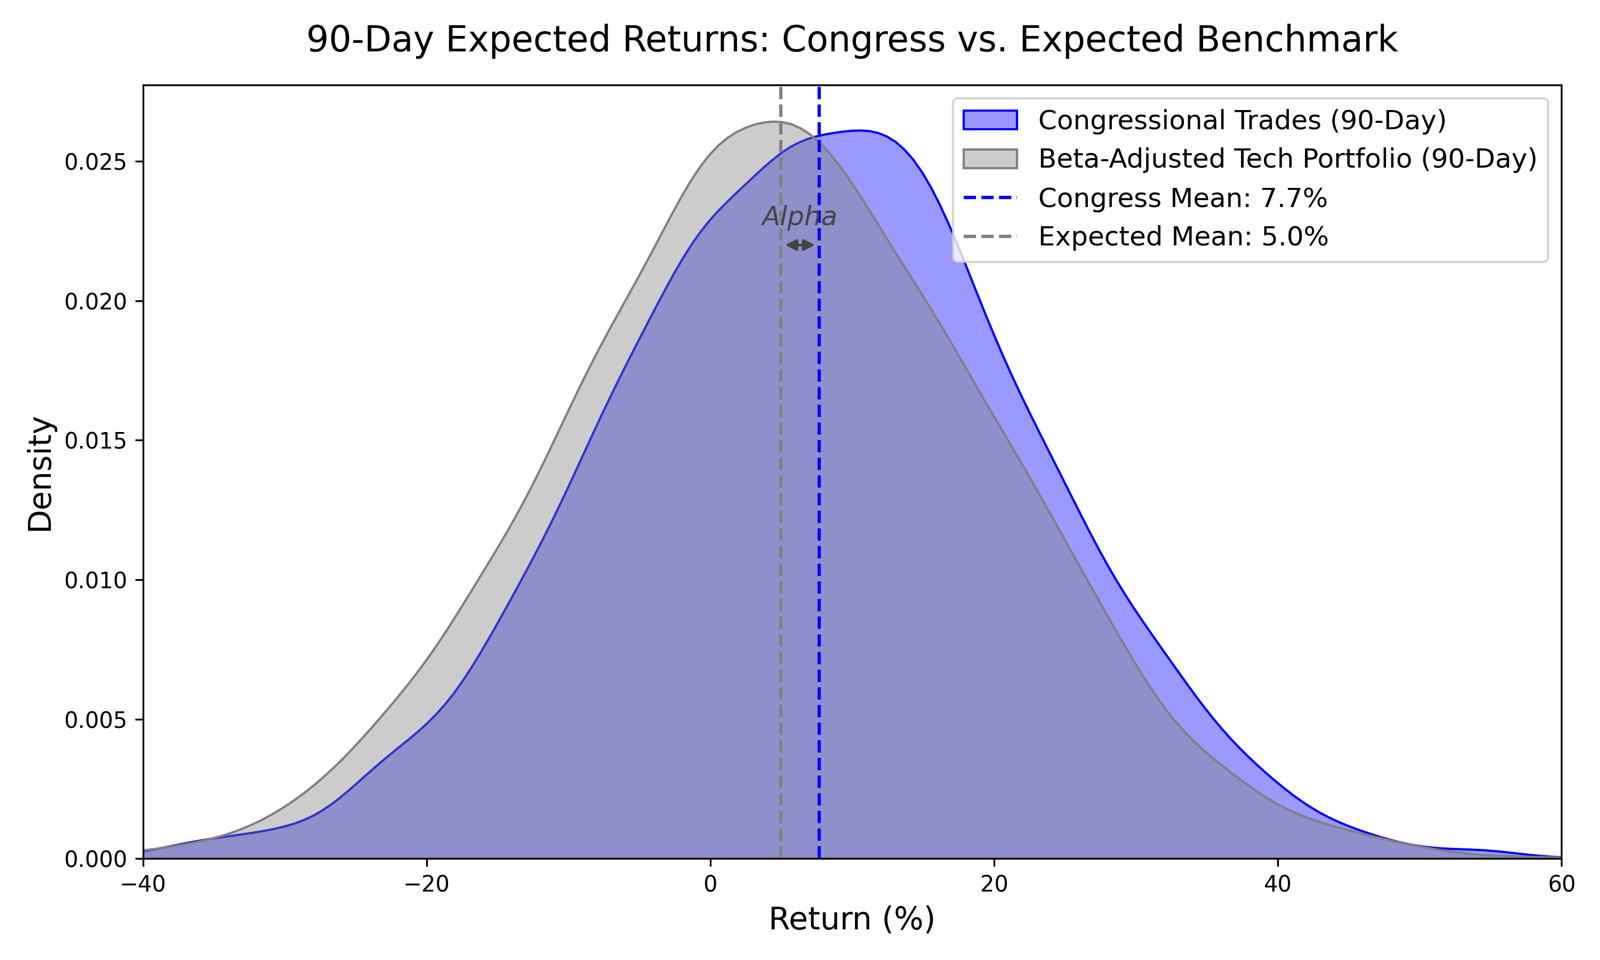
The mass of Congressional purchase returns sits to the right of the S&P 500 over the same windows. The +2.58 percentage-point gap is the area between the two means.
Source: efdsearch.senate.gov, disclosures-clerk.house.gov, Yahoo Finance (yfinance). Author calculations.
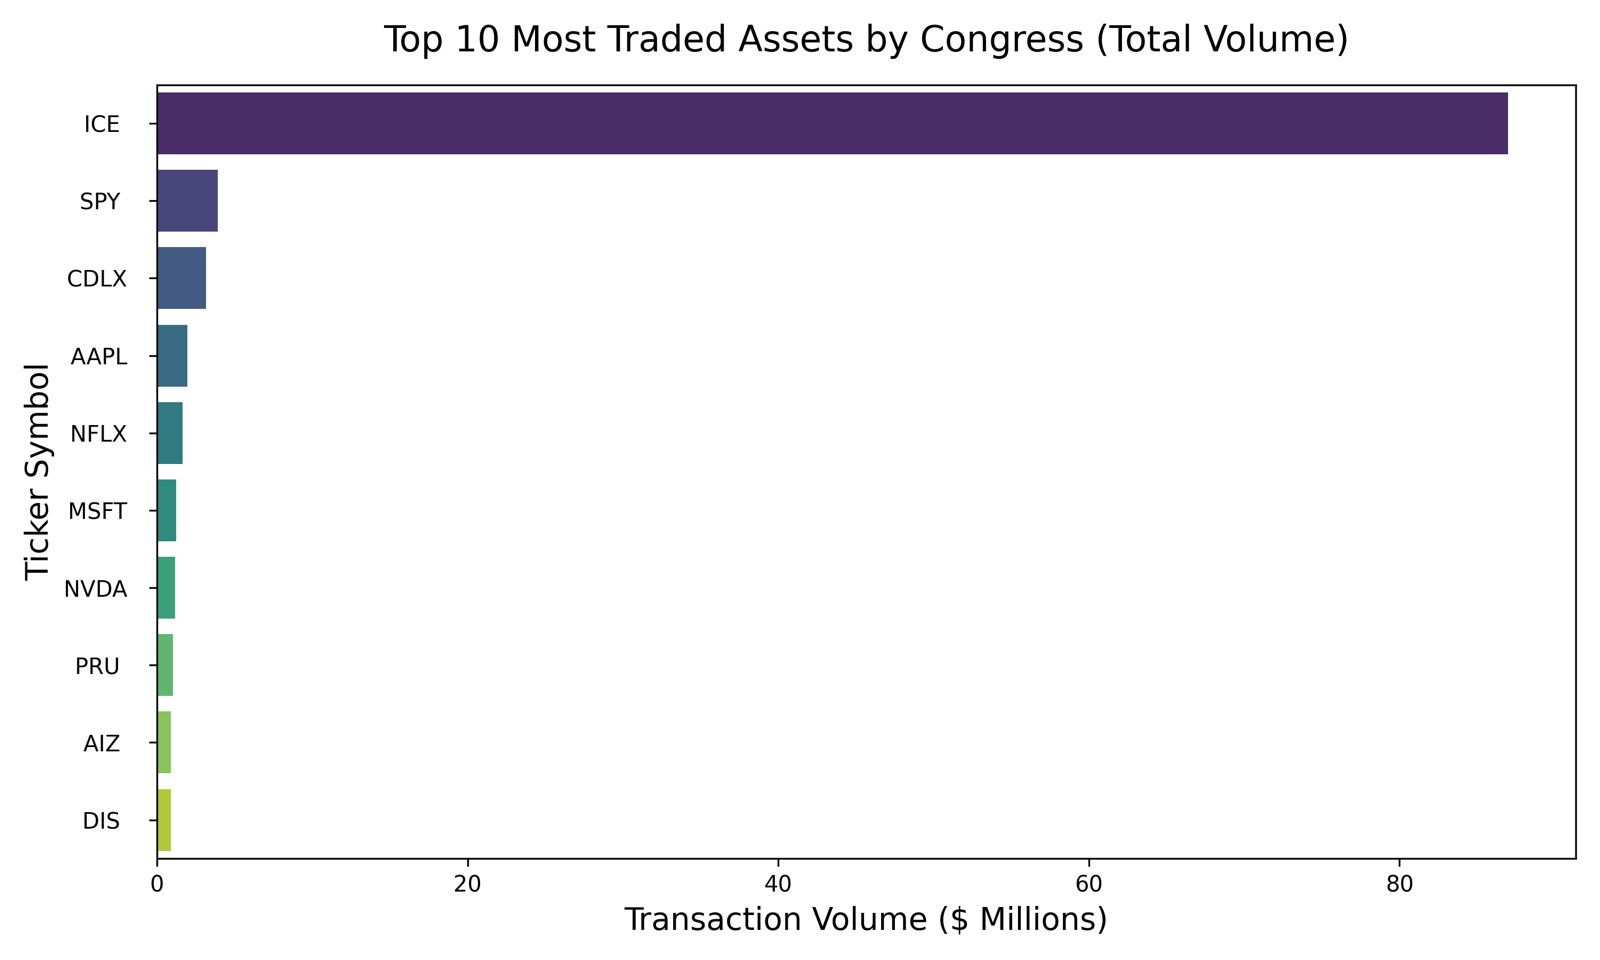
Large-cap tech and broad-market ETFs dominate the leaderboard. Concentration is a confound for the alpha number — sector tilt alone explains part of the outperformance.
Source: efdsearch.senate.gov, disclosures-clerk.house.gov. Author calculations.
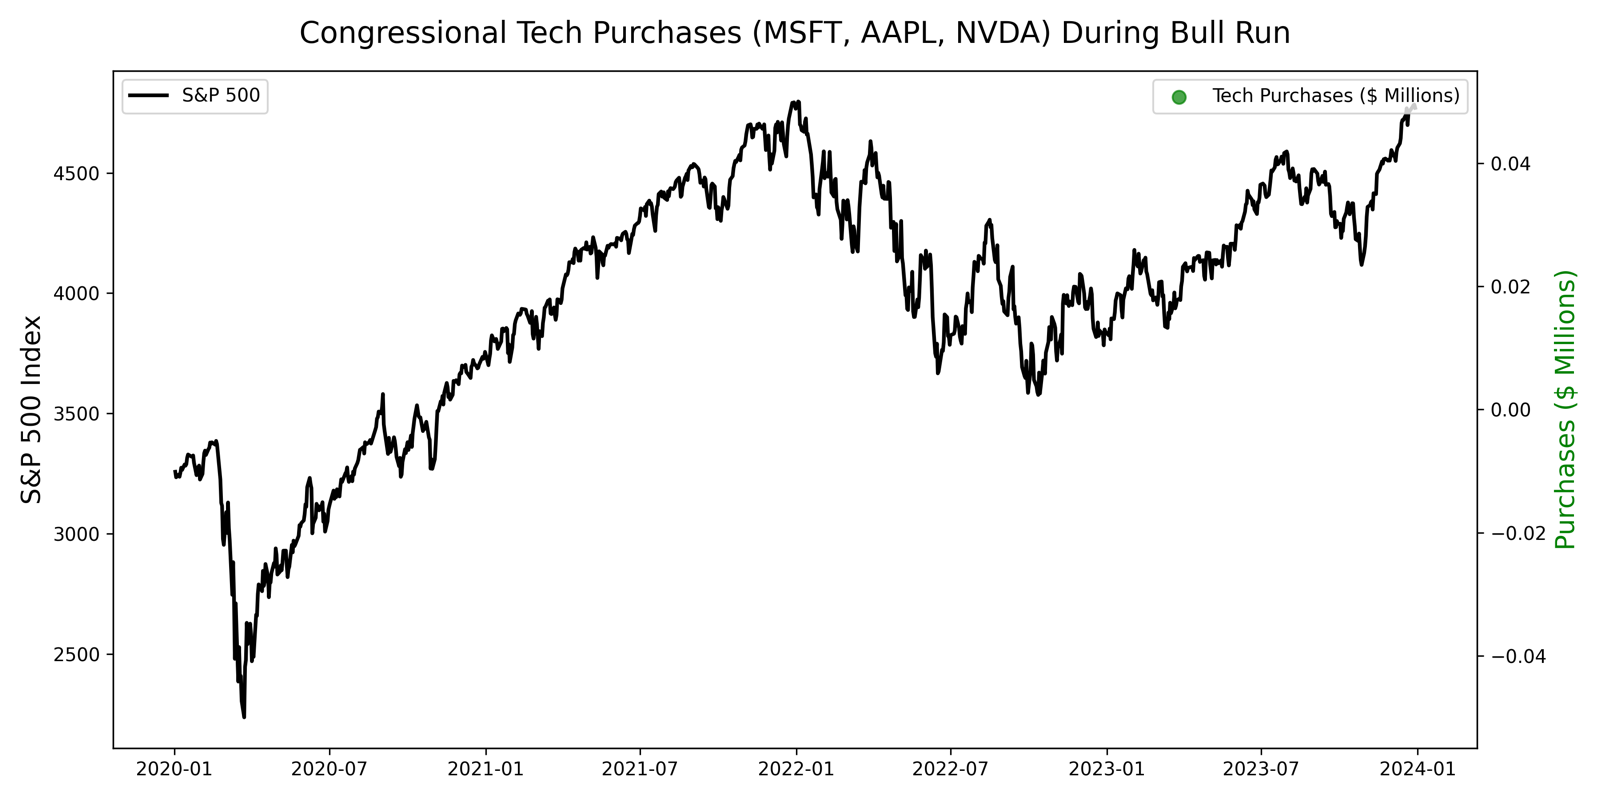
Tech purchase volume clusters around two regimes — the 2020 drawdown and the 2023 rally. Buyers were on the right side of both.
Source: efdsearch.senate.gov, disclosures-clerk.house.gov, Yahoo Finance (yfinance). Author calculations.
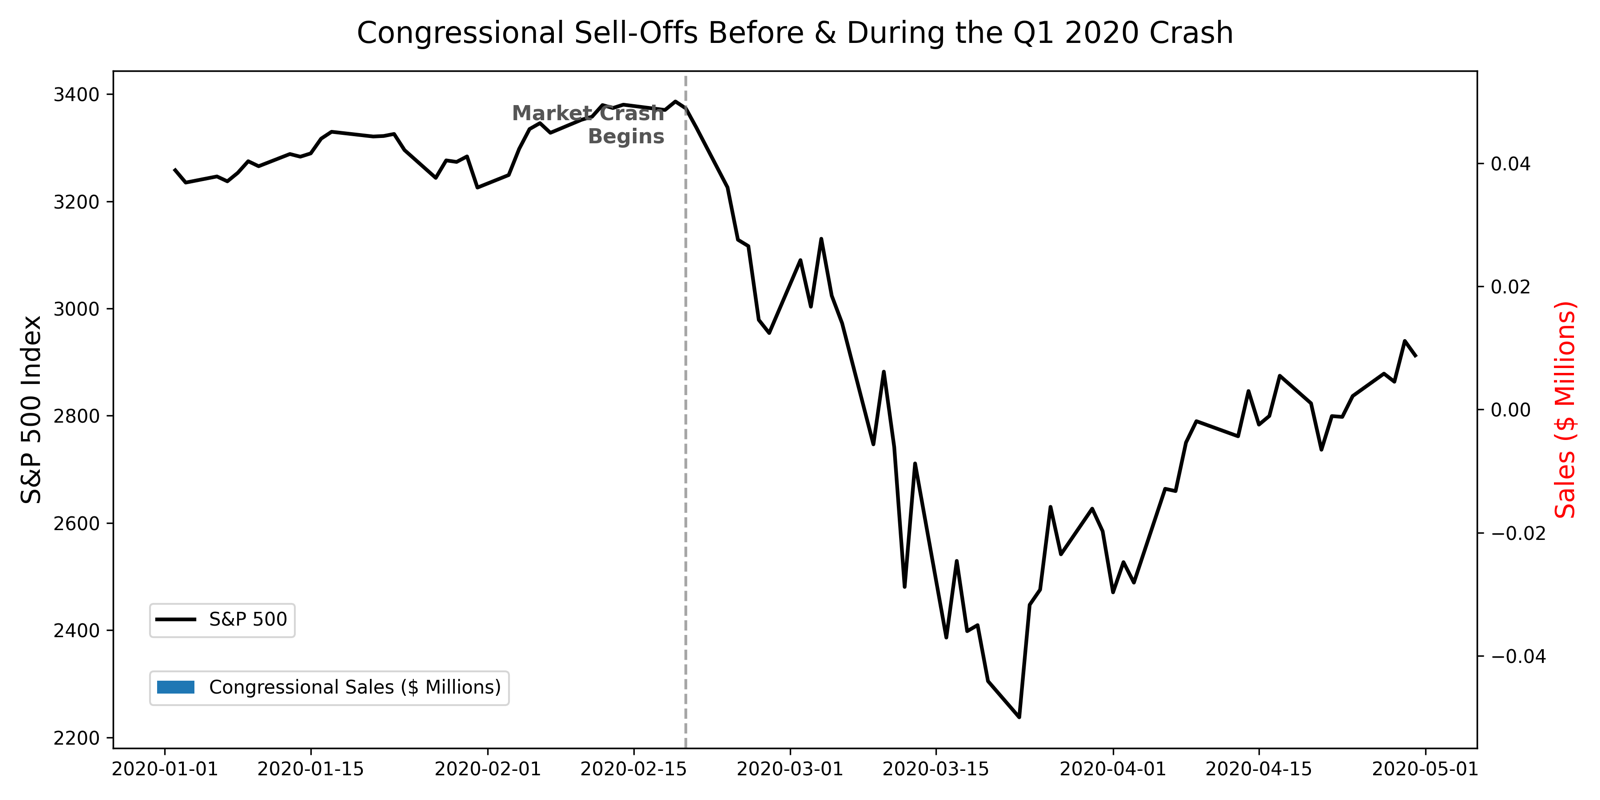
The top 5% of sellers concentrated their exits in the two weeks before February 20, 2020. Suggestive of foreknowledge — but the data alone cannot distinguish that from sector rotation, age-and-wealth effects, or skilled advisors.
Source: efdsearch.senate.gov, disclosures-clerk.house.gov. Author calculations.
Important disclosures & limitations
- Disclosure lag is large. PTRs can be filed up to 30–45 days after a trade, so the 90-day alpha measured from the transaction date is not a 90-day alpha available to a public follower in real time. The signal is retrospective.
- Selection bias on the benchmarked subset. Only 220 of 16,203 raw trades had a clean ticker, sufficient price history, and a clean entry/exit window. Heavy-tail trades (private placements, fund-of-fund holdings, options) are excluded.
- No multiple-testing correction. 30- and 180-day horizons and per-legislator slices were explored; only the 90-day headline was pre-registered.
- Causality is unidentified. Outperformance is consistent with non-public information, but also with sector concentration, age/wealth effects, or skilled advisors. The data cannot distinguish them.
- Not investment research. This document is an undergraduate course project submitted for QAC 420 at Wesleyan University. It is not investment advice and the findings are not actionable trading signals.
The Final Reflection expands on items 1–4.
Further reading
- Paper Abstract — 1-page academic summary.
- Paper Statistics writeup — the formal statistical workup behind the alpha number.
- Paper Final Reflection — 5-page essay on method, ethics, and future work.
- Repo Source code & dataset on GitHub.